
Decoding the ghost weather network at 929.6625 MHz
The Ambient Information Network, the commercial weather broadcast that fed the 2000s desk-gadget forecasters, is still transmitting in 2026. Monitoring hobbyists documented the record framing and the network behind it in 2020, and asked there how the numbers were encoded. As far as we can tell nobody answered. That is what this page works out.
What it is
The Ambient Information Network is a one-way weather datacast: a commercial broadcast of city forecasts, sent in the clear, addressed to consumer appliances that sold at least a million units. It rides a paging network, the same kind that fed 1990s pagers: a set of GPS-synchronized transmitters all sending the same thing on the same frequency, cheap receivers listening for their own number, and no way for any of them to answer back. The transmitters you hear are local, but the content is national, which is why an indoor antenna in one state pulls in cities from six others. It is FLEX, at 6400 baud. It still runs around the clock in 2026, carrying about 75 cities on a typical day.
Each city's message holds twelve printable characters: the first two are the current temperature, the remaining ten a five-day forecast, one pair per day, high then low. A short header wraps it, carrying the day of the week on the city's own clock, and a run of flag characters carrying the weather icons.
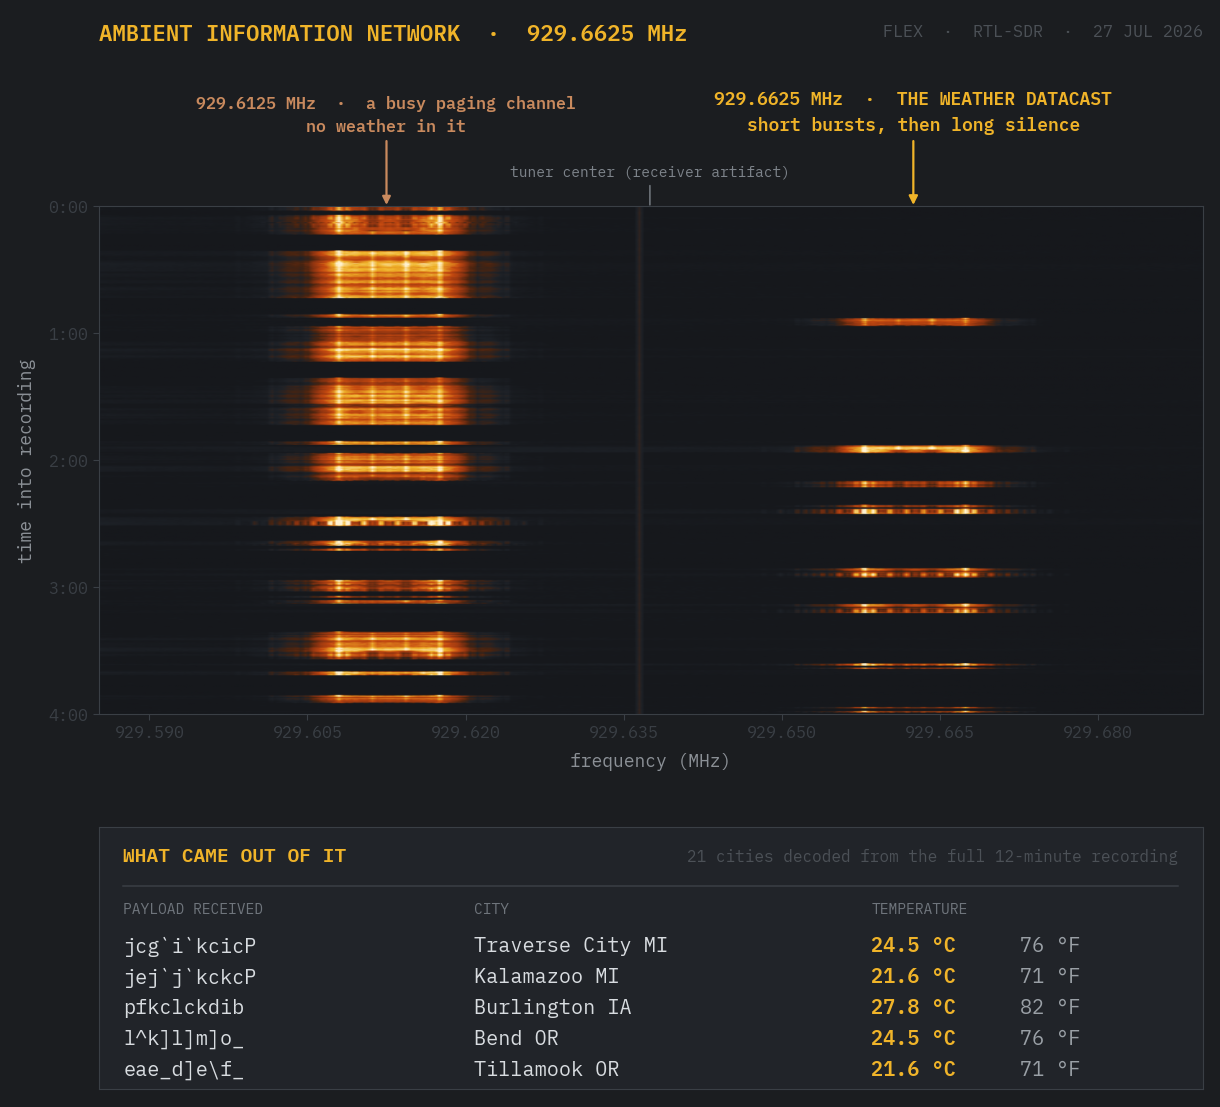
None of this needs unusual equipment. The recording above was made with a USB software-defined radio dongle and the little telescoping dipole that comes bundled with it, opened to about six inches tip to tip and sitting indoors, with free software doing the decoding. If you want to listen for yourself, our guide to the $40 dongle covers which one to get and how to set it up.
The network
AIN was the delivery system for Ambient Devices' weather line: the 5-Day Weather Forecaster and its Brookstone- and Bushnell-branded siblings, which the company claimed had sold over a million units by 2012. The devices were radio receivers with a factory-assigned address, displaying whatever the broadcast last sent them. Forecast data came from a single upstream provider (AccuWeather, printed on most faceplates).
From Ambient's own site: "the nationwide wireless Ambient Information Network" (2004), the flagship Forecaster at $99.99 (2005), and the promise that devices "require no setup—they automatically display the forecast for 150 cities across the United States" (2007). Citations at the bottom.
Monitors on RadioReference watched it go dark in February 2020, one of them reporting San Antonio silent before midnight on the 13th, with Portland, Boston and parts of Indiana going the same way around then. Whatever happened, something is still transmitting in 2026, around the clock, and the identifiers it addresses suggest it is not the old retail broadcast. The company's site is still standing, though its customer login stopped answering long ago, and we could not establish who is paying a paging carrier to keep this going. It is a bit of a ghost in the machine.
Who the broadcast addresses
The addresses are FLEX capcodes, leased from the paging carrier. Two things in the traffic are worth noting about them.
- The city labels are a private, non-standard scheme. Spokane transmits as
SPO, Tacoma asTAC. Some coincide with more standard schemes by chance, which misleads more than it helps, and there is no public list to look them up in. That is why 53 of the codes heard here are still unplaced. - The capcodes run in tight blocks that ignore geography. One block spans a city in Washington State and a city in Pennsylvania. Blocks like that are how a carrier hands out addresses, not how cities are organized, so a capcode is better read as a content stream than as a place: every device set to Spokane listens on the Spokane capcode. That also means the 113 addresses heard here are not a city count, since one packet can carry several cities.
From 150 cities to 60
Ambient's 2007 site advertised 150 default cities; the list it actually published held 148. Crossed against what is heard in 2026:
- The broadcast addresses 113 distinct destinations. 60 send a city name we can resolve; the other 53 arrive as three-letter codes we cannot yet place.
- Of the 60 we can name, 20 appear on the 2007 list. The 53 unresolved codes could be on it too, so the real overlap is somewhere between 20 and 73 out of 113, and only the bottom of that range is measured.
- The other 40 named cities are not on that list at all, and they skew small: Christopher, Illinois, population about 2,300. Tillamook, Oregon. Caribou, Maine. Kewanee. Murphysboro.
The broadcast is unchanged in character: open, unaddressed to any person, and receivable by anyone in range.
The patent sheds some light
Ambient patented the system. US application 2007/0035661, "Methods and apparatus for displaying transmitted data", describes an earlier forecaster whose screen drew temperature as a column of dots rather than numerals, and sets out how a forecast was encoded.
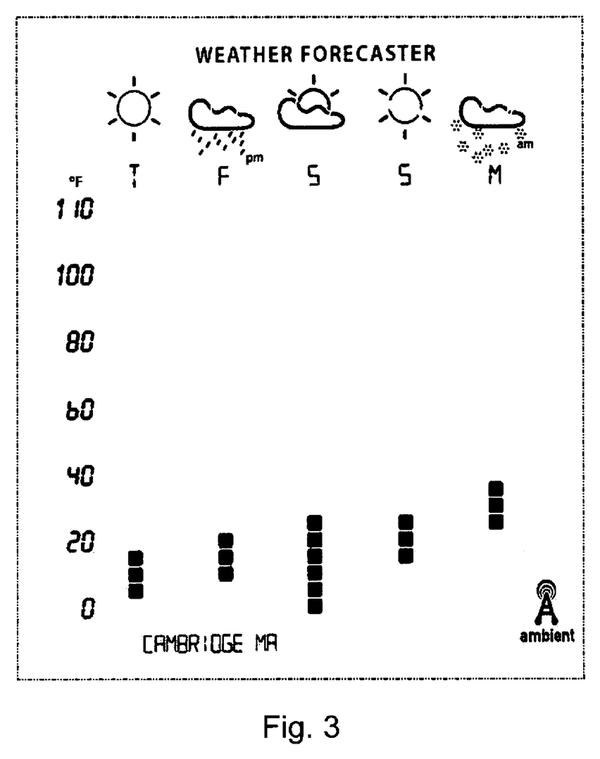
Its budget for one location is about 25 bytes: two for the temperature scale, three for five weather icons, one for the day-of-week letters, six for the temperature dots, and thirteen for a text label. That is the same system one generation earlier, running a different format: the 2026 signal carries numerals rather than dots and fits a city into twelve characters.
Four things in it line up with what the signal shows now. Day-of-week is a real transmitted field rather than an artifact of our reading. Weather icons are their own field of sixteen states at four bits each, which is the right shape for the flag run described below. Devices are addressed by a unique identifier obtained from the paging operator. And several cities travel in one packet.
One line settles a question our decode could not. The patent notes that "smaller micropackets of a single byte can be used to update only the current temperature", separately from the forecast. That explains why the current temperature sits in its own character range and needs its own model: it is a different kind of update, not part of the forecast block.
The payload format
Each city's message carries a 12-character payload of printable ASCII, structured as six two-character pairs.
The trick to reading it is that the alphabet is the thermometer. Each character stands one step warmer than the one before it, and the step is two degrees Fahrenheit, so b is 2 °F above a and a temperature arrives written as a letter.
Pair 0 is the current temperature, written as a two-digit number. The first character is a coarse step of 3 °F. The second is a fine digit worth 0, 1 or 2 °F, which is why that position only ever holds @, A or B: it is counting in base three, and @ is zero. Together they give whole degrees Fahrenheit:
current °F = 3 × first character − 196 + (second character − `@`)
Checked against 1,089 National Weather Service observations across 36 cities, that lands 1.9 °C from the reported temperature on average, with no systematic bias either way. What remains is mostly the distance between a city and the weather station we compared it to, and it does not shrink when the readings are matched more tightly in time.
Pairs 1-5 are a five-day forecast: one day per pair, high then low. The evidence:
- The alphabets. Within each pair, the first character sits above the second by 9 character positions, usually between 7 and 11. At the scale the calibration establishes, that is about 10 °C (18 °F): the signature of a daily high and low, and close to the average daily temperature range across a continent in summer.
- The day-boundary shift. If pairs 1-5 are a rolling forecast, the columns should shift left by one each day: today's "tomorrow" is yesterday's "day after." Across 927 receptions a day apart, they do, matching 96% of the time.
- The scale. Character position tracks published forecast temperatures in a straight line, landing within about 2 °C of the forecast at both ends of the day.
One verbatim record
An example. The 12-character payload as transmitted:
ZBkbicecfbfb
Split into its six pairs:
| Pair | Chars | Encodes | Decoded |
|---|---|---|---|
| 0 | ZB |
Current temperature | 24.4 °C / 76 °F |
| 1 | kb |
Day 1 high / low | 30 / 18 °C (85 / 64 °F) |
| 2 | ic |
Day 2 high / low | 27 / 19 °C (81 / 66 °F) |
| 3 | ec |
Day 3 high / low | 23 / 19 °C (73 / 66 °F) |
| 4 | fb |
Day 4 high / low | 24 / 18 °C (75 / 64 °F) |
| 5 | fb |
Day 5 high / low | 24 / 18 °C (75 / 64 °F) |
The scale is in Fahrenheit, and one step along the alphabet is two degrees of it. Both halves of a pair use that same step and differ only in where they start:
high °F = 2 × the character's code point − 129
low  °F = 2 × the character's code point − 132
So a reads 65 °F as a high and 62 °F as a low, and every letter after it adds two. Whole degrees Fahrenheit at 2 °F resolution is the natural choice for something sold in American shops, and it explains why the values never carry a decimal place: there is nothing finer to carry.
Checked against the National Weather Service's published forecasts, which anyone can repeat, highs and lows both land about 2 °C away. That figure is a property of the yardstick more than of the decode, which the next paragraph gets to.
A caveat about the yardstick. The NWS is an independent forecaster, not the source this broadcast carries, so a disagreement between the two can mean our decode is off or simply that two forecasters differ on the same day. The error figures above are therefore an upper bound on decode error. A tighter number would need the provider's own feed, which you would have to take on trust. The bound is checkable.
A few records
Tacoma, Green Bay, Niagara Falls, Las Vegas, Alexandria, Brownsville.
Each row takes a single forecast day out of that city's most recent clean reception and compares it against the National Weather Service forecast for that same date. The rows use forecast days one to three, whichever the archive still covered. The cities were not heard at the same moment and do not need to be, since every row is an independent check.
| city | forecast characters | day | decoded high / low °C | NWS high / low °C | diff |
|---|---|---|---|---|---|
| Tacoma WA | i`g]h]h\j^ |
1 | 27 / 16 | 25 / 14 | +2 / +2 |
| Green Bay WI | memcj`jajc |
3 | 28 / 16 | 29 / 17 | -1 / -1 |
| Niagara Falls NY | icjcjdhbga |
3 | 28 / 20 | 28 / 19 | +0 / +1 |
| Las Vegas NV | umumulvmvm |
1 | 41 / 30 | 43 / 29 | -2 / +1 |
| Alexandria LA | ogpgpgqgng |
3 | 35 / 23 | 37 / 25 | -2 / -2 |
| Brownsville TX | piqjpipiqj |
2 | 36 / 27 | 36 / 27 | +0 / +0 |
Mean absolute difference: 1.2 °C on the highs and 1.2 °C on the lows, against real forecasts running from 14 to 43 °C. Highs and lows are checked separately here. The cities run from the Pacific Northwest coast to the desert to the subtropical border, and all of them land within a degree or two at both ends of the day.
Most of these cities transmit their names in clear text; Las Vegas is identified by its 3-letter code, which the agreement here corroborates, since a payload matched to the wrong city misses by a lot.
The ten characters shown are the forecast half of the payload, which both of the network's message framings carry identically. Paste any of them into the decoder and read the row for the day this table quotes.
Decode a record yourself
Try these, each exercises something different:
\Boekblckdicclean record, all six pairs valid.^@mfj`k`jbkCa real reception with one dropped bit; the last character falls below the alphabet floor and the decoder refuses that pair.~&=/&Y@ielgofmckb"""!!BLMa complete line as received; the decoder finds the 12 characters inside it, plus the weekday and city code around them.ZBaaaaaaaaaaevery character legal, but each pair identical, so the high-to-low gap is zero throughout. The decoder accepts the characters and then says the pairs are not behaving like a daily high and low.
Over the air, characters sometimes arrive damaged. Nothing in our capture falls below the character [, so characters below it are thrown out before fitting. A single bad character left in is enough to throw the scale off, which makes the filter the difference between a right answer and a confident wrong one.
That filter has a season in it. [ sits at roughly 51 °F, and every record behind it was received in July, in cities that never got that cold. So "too cold to be real" and "damaged" are currently the same test, and in January they will stop being the same thing: a genuine overnight low in Green Bay lands below the floor and gets discarded as damage. The filter is right about the records we have and cannot be trusted outside the weather they were captured in. A winter capture settles it, and until then a cold reading here should be read as unknown rather than as corruption.
The header carries a local weekday
Three of the five header characters are fixed framing and one identifies the city. The fifth is a date, and it runs on each city's own clock. Group the records by UTC date and the field looks noisy; group them by local date and it snaps into place. The changeover settles it: the value advanced at 00:15 local in Central, then 00:15 in Mountain, then 00:10 in Pacific. One zone per hour, moving west.
It is a weekday rather than a calendar date, advancing one step a day and wrapping around at the end of the week. Two weeks of continuous capture have now observed all seven codes in their expected slots: ! Monday, " Tuesday, # Wednesday, $ Thursday, % Friday, & Saturday, ' Sunday. Each rests on the same test - take each city's dominant value for its own local day, and count how often it matches - and each lands between 70 and 93 per cent of city-days.
The flag run holds the icons
Ambient's umbrella patent says the forecaster's screen used "icons to represent the likelihood of precipitation". That is a testable claim, because the National Weather Service publishes a chance of precipitation for every city and day.
The stronger test came from a week of continuous capture: take each city's dominant flag string for a day, line flag position one up with that same day (the alignment that wins outright against its rivals), and score each symbol against the rain that actually fell there, using public daily precipitation records. Roughly 750 symbol-days over the 35 best-located cities:
| code | symbol | reading | days it actually rained |
|---|---|---|---|
| 0 | ! |
clear | 1% |
| 1 | " |
partly cloudy | 8% |
| 3 | $ |
overcast or fog, dry | 12% |
| 5 | & |
showers possible | 30% |
| 2 | # |
rain likely | 38% |
| 6 | ' |
rain | 88% |
Two things the earlier, smaller capture got wrong, corrected here. First, the scale is not a simple drier-to-wetter ladder: $ sits mid-alphabet but marks a dry sky - its home turf in this capture was the marine-layer coast (Tillamook, Olympia, Tacoma) on days that stayed rain-free even at a trace threshold. It reads as the overcast-or-fog picture, not a rain tier. Second, the actual rain symbol is ': cities carrying it got measurable rain almost nine days in ten, and it lit up exactly where the weather was - a line of Iowa river towns on one stormy Wednesday, all showing it together.
One coincidence worth naming so nobody trips on it: & and ' also appear in the header as the Saturday and Sunday weekday codes. Different field, different meaning - the weekday lives at a fixed header position, the icons live in the flag run - and the two decode independently.
Six of sixteen states, still mostly the summer end of the range. The decoding is a work in progress: these readings rest on one July week of ground truth, and the wintry pictures cannot appear until the seasons turn. The table stops where the evidence stops.
What is left
Nothing about the structure is a mystery now. What is missing is coverage: ten more icon states, most of them presumably the wintry and severe pictures other seasons will produce, one weekday code waiting on a well-captured Friday, and the city labels with no public list to resolve them against. The labels turned out to yield to insight after all: because each transmission carries a package of nearby cities, a label that shares its lines with known cities inherits their neighborhood, and the label itself is usually an abbreviation of some town there. That resolved most of them, including two towns the label alone would never give up - DQ is Du Quoin, Illinois, seven miles from its package-mate Christopher, and PRI is Peru, the twin city of La Salle. About three dozen labels, from packages containing no known city, are still open.
We'll update the page as we learn more.
If this is your kind of puzzle, write to contact@emergencyradio.org. Same address if you know of an earlier decode of this payload, and we'll link it here.
Want to listen for yourself? Work like this runs on a software-defined radio, the class of ~$40 USB receiver that turns any computer into a wideband set. Our software-defined radio guide covers which one to get and what it will hear.
Sources
Scope. This is a one-way commercial broadcast sent in the clear, with no encryption, no scrambling and no privacy modulation, addressed to appliances rather than to persons, and received the way any over-the-air broadcast is received. The only content examined, retained, or written about is the weather datacast itself. Findings describe the data format; individual forecast values are facts and not owned by anyone, but the provider's compiled feed is their product. The handful of records shown above are a fixed historical snapshot published for verification, never refreshed, and no feed is republished in bulk here. Find an error, tell us, and it gets corrected prominently.
- "Ambient Devices product catalog" ("the nationwide wireless Ambient Information Network"). ambientdevices.com. Archived from the original on April 6, 2004. Retrieved July 26, 2026.
- "5-Day Weather Forecaster order form" ($99.99). ambientdevices.com. Archived from the original on November 19, 2005. Retrieved July 26, 2026.
- "Forecasts for 150 cities" ("require no setup—they automatically display the forecast for 150 cities across the United States"). ambientdevices.com. Archived from the original on October 13, 2007. Retrieved July 26, 2026.
- Resner, Rose, Hyatt, Dredge and Gandhi. "Methods and apparatus for displaying transmitted data". US patent application 2007/0035661, Ambient Devices Inc, published February 15, 2007.
- "About the Company" (over one million units sold). ambientdevices.com. Archived from the original on January 23, 2012. Retrieved July 26, 2026.
- "Ambient Information Network - Datacasting Service". RadioReference.com forums, thread 399490, 2020-2023. The prior art for everything structural here: the two channels and the product tiers behind them (929.6625 for the five-city units, 929.6125 for the units that scroll all 150), FLEX-A and FLEX-C at 6400 baud, the capcodes, raw records showing the framing and the plain-text city label, the roughly half-hourly cycle, the carrier chain back through USA Mobility to PageMart, and the February 2020 shutdown. The encoding of the numbers is asked in that thread ("but how are the numbers for temperatures represented?") and is not answered in it. Retrieved July 28, 2026.